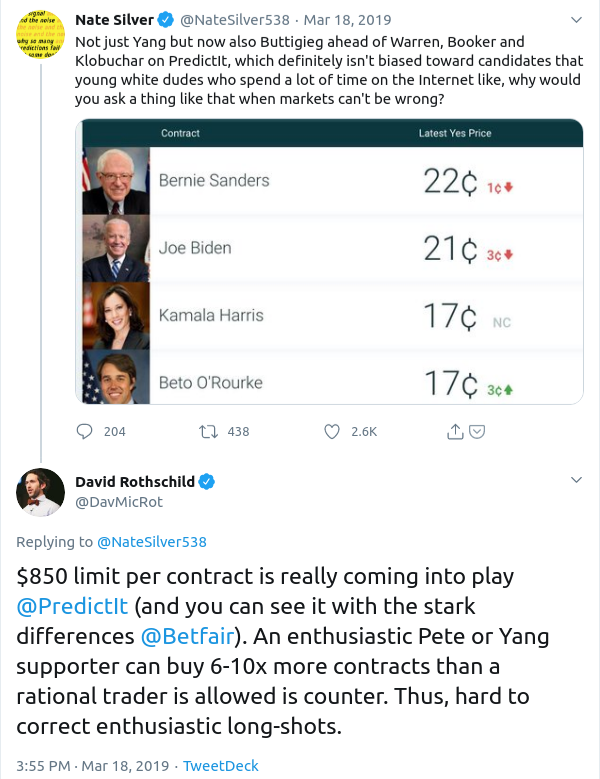
What might betting markets tell us about electability?
By using data from a betting market for political events, we can get an estimate for the 'electability' of candidates. On predictit.com, users can bet on which candidates will win each major party's nomination, and on which candidates will win the general election. By dividing the price of the latter contracts by the price of the former, we get an estimate for the conditional probability that a candidate wins the general election given they were chosen as their party's nominee. This is the notion of electability. If nominated, what are the odds of beating your opponent in the general election?
The charts below show how major candidates' nomination probabilities and conditional probabilities have evolved through time.
Technical details:
Betting market contract data is pulled every 5 minutes using the predictit API. Daily averages of contract values and their corresponding ratios are computed and rendered. To avoid spurious spikes in the chart due to division by small numbers, the conditional probability is only rendered when a candidate's probability of winning the party's nomination is above 15%. The conditional probability arises from Bayes' Theorem, which states
\(\text{for the events }\)
We are implicitly assuming that \(P(Nom|Pres) = 1\), ie that there is no chance a candidate can win the presidency without having received their major party's nomination.
Interpretation and comments:
Unfortunately, the time series are quite erratic, and there are no obvious grand narratives. That the Democratic nominees were each more electable than Donald Trump throughout 2019 speaks mostly to voters' preference for any Democrat over Trump -- what we are more interested in is the electability of Democratic candidates relative to one another. Almost all the Democratic candidates had their moment in first place with regard to the electability metric, and none of them scored higher than the others over a long period.
These numbers do not tell us about the states of the world in which a candidate is likely to be more or less successful. We have to make those inferences ourselves. For instance, at the peak of her popularity Warren had a 52% probability of being nominated. "Squad" members AOC, Ilan Omar, and Rashida Tlaib endorsed Sanders shortly thereafter, and around the same time Warren began to waiver in her support for Medicare-for-All. These were blows to her credibility as a progressive candidate. Too timid in her willingness to enact institutional change for progressives, but still too harsh in her criticisms of those same institutions for establishment Democrats longing for a return to the Obama years, in the end she failed to arouse enthusiasm in either faction. Her nomination probability declined, as did her conditional probability of becoming president. A longer discussion around this general topic is contained in Wolfers & Zitzewitz (2006), starting on p.14.
Finally, betting limits and high transaction costs prevent Predictit from being an ideal market. The former makes it much easier to buy cheap shares than to sell them short, and the latter prevents pure arbitrage, allowing for prices to drift far from their fair value. As two experts commented on Twitter,